Hron_Turek fluid-solid interaction benchmark: HronTurek
Prepared by Željko Tuković and Philip Cardiff
Tutorial Aims
- Demonstrates how to simulate the well-known Turek and Hron [1] fluid-solid interaction benchmark in its three variants,
FSI1,FSI2andFSI3.
Case Overview
An elastic plate behind a rigid cylinder is a well-known benchmark fluid-solid interaction case proposed by Turek and Hron [1]. The geometry (Figure 1) consists of a horizontal channel of 0.41 m in height and 2.5 m in length, containing a rigid cylinder with a radius of 0.05 m; the centre of the cylinder is positioned 0.2 m away from the bottom and inlet (left) boundaries of the channel. An elastic plate of 0.35 m in length and 0.02 m in height is attached to the right-hand side of the rigid cylinder.
Fluid enters the channel from the left-hand side with a parabolic velocity profile. A constant pressure is imposed at the channel outlet, and a no-slip boundary condition is applied at the walls. The fluid flow is assumed to be laminar, and the plate deformation is computed under the plane strain assumption. Turek and Hron [1] examined three variants of this case, which differ in the inflow velocity and the plate material (Table 1):
FSI1has a low inflow velocity (Re = 20), and the flow and the plate settle to a steady state;FSI2has a heavy, soft plate that flaps periodically with a large amplitude (Re = 100);FSI3has the highest inflow velocity (Re = 200) and a stiffer plate, which oscillates periodically with a smaller amplitude and a higher frequency.
FSI3 is the default variant of the tutorial. For FSI3, the inlet velocity profile is applied without a gradual increase in the mean velocity, so that the periodic motion is reached quickly. For FSI1 and FSI2, it is ramped over 2 s with the smooth ramp of the benchmark. In all three variants, the coupling between the fluid and the solid is activated after 2 s.
The tutorial and verification study both use StVenantKirchhoffElastic, the St. Venant-Kirchhoff constitutive law specified by the benchmark. For FSI3, both use outerCorrTolerance 1e-5; at 1e-6, the IQN-ILS residual occasionally stalls just above the tolerance during longer runs.

Figure 1: Computational domain with a structural detail for the elastic plate case. All dimensions are in m.
Table 1: Problem Physical Parameters
| Parameter | FSI1 | FSI2 | FSI3 | Units |
|---|---|---|---|---|
| Fluid density, \(\rho_F\) | 1000 | 1000 | 1000 | kg/m\(^3\) |
| Fluid viscosity, \(\nu_F\) | 0.001 | 0.001 | 0.001 | m\(^2\)/s |
| Mean inlet velocity, \(\bar{u}\) | 0.2 | 1 | 2 | m/s |
| Solid density, \(\rho_S\) | 1000 | 10000 | 1000 | kg/m\(^3\) |
| Solid Young's modulus, \(E_S\) | 1.4 | 1.4 | 5.6 | MPa |
| Solid Poisson's ratio, \(\nu_S\) | 0.4 | 0.4 | 0.4 | |
| Reynolds number, \(Re\) | 20 | 100 | 200 |
Expected Results
The benchmark reports the displacement of the plate tip point A at (0.6, 0.2) and the drag and lift on the cylinder and plate together, per unit depth. For the periodic variants they are given as mean ± amplitude [frequency], where the mean and amplitude are calculated from the maximum and the minimum over the last period. Table 2 gives the Featflow reference values [4] and the results of the verification study of this tutorial on its 2x mesh (see Verification Study).
Table 2: Displacement of point A and the force on the cylinder and plate. The displacements are in mm and the forces in N/m. The periodic values are given as mean ± amplitude [frequency in Hz]. For FSI3, only the quantities recorded in the verification README are shown.
| Variant | Quantity | solids4foam, 2x mesh | Featflow [4] |
|---|---|---|---|
| FSI1 | \(u_x\) | 0.02248 | 0.02270 |
| FSI1 | \(u_y\) | 0.7828 | 0.8209 |
| FSI1 | drag | 14.261 | 14.294 |
| FSI1 | lift | 0.7756 | 0.7637 |
| FSI2 | \(u_x\) | −14.40 ± 12.46 [3.93] | −14.85 ± 12.70 [3.86] |
| FSI2 | \(u_y\) | 1.25 ± 80.55 [1.96] | 1.30 ± 81.6 [1.93] |
| FSI2 | drag | 216.0 ± 79.2 [3.93] | 215.1 ± 77.7 [3.86] |
| FSI2 | lift | −0.9 ± 256.3 [1.96] | 0.6 ± 237.8 [1.93] |
| FSI3 | \(u_x\) | −2.79 ± 2.66 | −2.88 ± 2.72 [10.93] |
| FSI3 | \(u_y\) | ± 34.17 [5.52] | 1.47 ± 34.99 [5.46] |
| FSI3 | drag | 459.3 ± 28.1 | 460.5 ± 27.7 [10.93] |
| FSI3 | lift | ± 174.4 | 2.50 ± 153.9 [5.46] |
On the 2x mesh, the displacements, drag and frequencies are within about 2–5% of the reference, and the lift amplitude, which converges slowest, is 8% (FSI2) and 13% (FSI3) high. The verification README gives the acceptance criteria, the 1x results and the convergence between the meshes.
FSI3
Figure 2 shows the plate deformation at the time instant when the plate tip point (A) is at its highest position. Video 1 shows the time evolution of the pressure field in the fluid and the displacement magnitude field in the solid. Figures 3 and 4 show the plate tip displacement and the total force on the plate and cylinder, after the periodic solution has been reached, from Tuković et al. [2]. Figure 5 overlays the closing periods of the verification run on the 2x mesh on the published reference history.
Figures 3 and 4 were generated with the mesh and time settings used inTuković et al. [2], whereas Figure 2 and Video 1 were generated using thedefault settings in the tutorial case.

Figure 2: Snapshot of the pressure field in the fluid and the equivalent (von Mises) stress field in the solid
Video 1: Time evolution of the pressure field in the fluid and the displacement magnitude field in the solid.

Figure 3: Displacement of the plate tip point A for the elastic plate behind a rigid cylinder case

Figure 4: Force on the plate and the cylinder for the elastic plate behind a rigid cylinder case
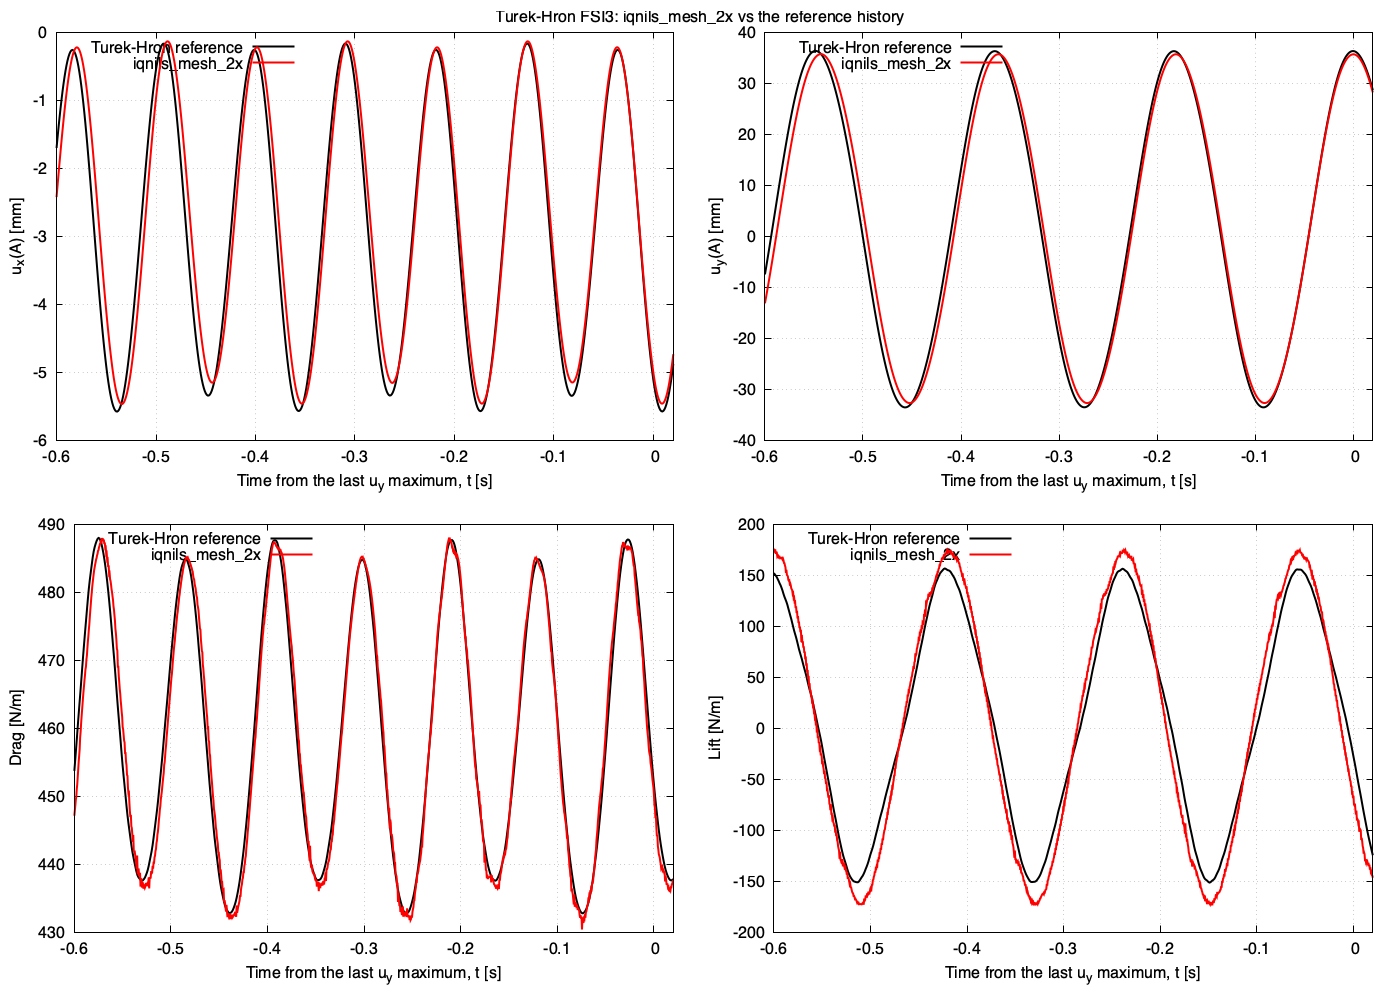
Figure 5: FSI3 verification run on the 2x mesh (red) against the Turek-Hron reference history (black), with time measured from the last maximum of \(u_y\)
FSI2
The plate flaps with a tip amplitude of about 80 mm at about 1.9 Hz. The flapping grows from rest after the coupling starts and saturates after about 7.5 s. Figure 6 overlays the closing periods of the verification run on the 2x mesh on the published reference history.
The fluid mesh distorts slowly while the plate flaps, and IQN-ILS eventually stops converging: after about 11.4 s on the 2x mesh and 18.7 s on the 1x mesh. The FSI2 variant therefore stops at 10.5 s.
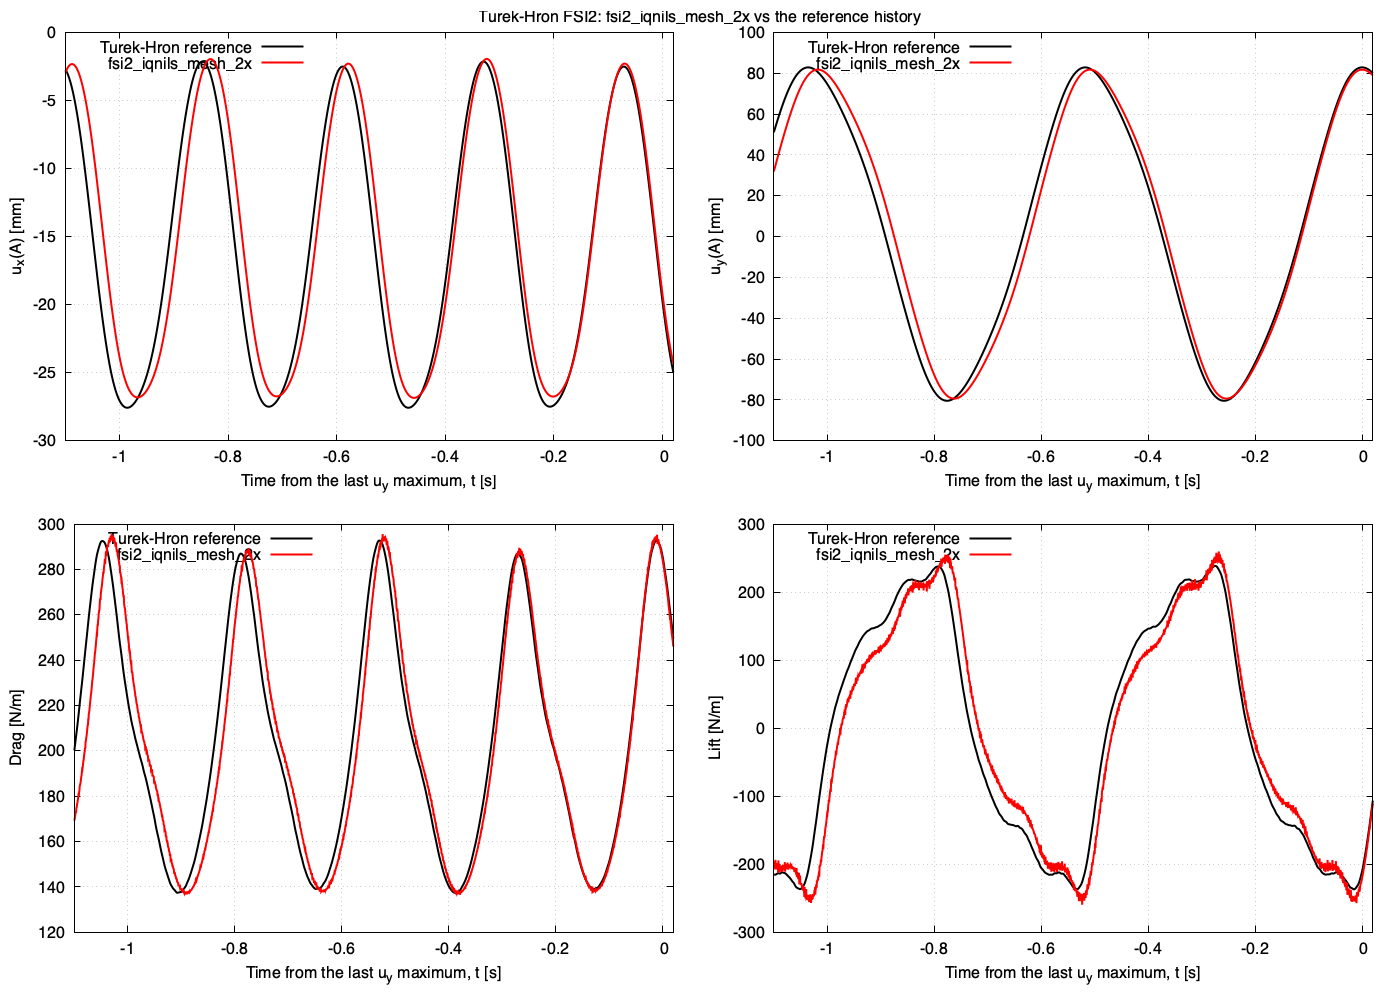
Figure 6: FSI2 verification run on the 2x mesh (red) against the Turek-Hron reference history (black), with time measured from the last maximum of \(u_y\)
FSI1
The plate settles to a steady deflection of about 0.8 mm. Figure 7 shows the tip displacement of the tutorial run with ./Allrun fsi1 on the tutorial (1x) mesh, which is within 0.1% of its final value from about t = 9 s. The steady u_y(A) of 0.705 mm is 14% below the Featflow value (dashed); the error falls to 4.6% on the 2x mesh of the verification study (Table 2). The run took about 13 minutes in serial.
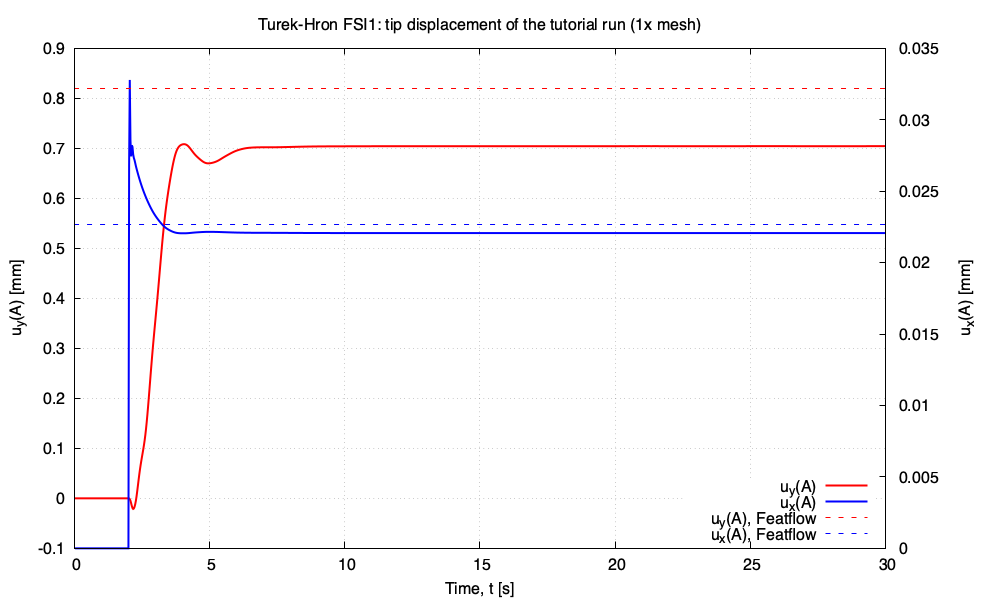
Figure 7: FSI1 tip displacement history of the tutorial run, computed with the tutorial settings.
Running the Case
The tutorial case is located at solids4foam/tutorials/fluidSolidInteraction/HronTurek. The case can be run using the included Allrun script, i.e. > ./Allrun, which runs the FSI3 variant. The Allrun script first executes blockMesh for both solid and fluid domains (> blockMesh -region fluid and > blockMesh -region solid), and the solids4foam solver is used to run the case (> solids4Foam). Optionally, if gnuplot is installed, a file deflection.pdf will be created with the displacement history of point A and a file force.pdf will be created with the history of the force on the cylinder and plate.
The variant is selected with fsi1, fsi2 or fsi3 (the default):
./Allrun                   # FSI3, Dirichlet-Neumann IQN-ILS coupling
./Allrun fsi1              # FSI1
./Allrun fsi2 parallel     # FSI2 in parallel
./Allrun fsi3 robin        # FSI3 with Robin-Neumann coupling
The case is stored as FSI3. For fsi1 and fsi2, Allrun edits the inlet velocity and ramp (0/fluid/U.*), the plate density and Young's modulus (constant/solid/mechanicalProperties) and the time step, end time and write interval (system/controlDict). It keeps the stored files as *.stored and restores them when it exits, so edits made to these files during the run, for example to the controlDict, are discarded. FSI1 runs as a pseudo-transient route to the steady state with Δt = 0.025 s to t = 30 s. Its loads are 30 to 40 times smaller than those of FSI3, so it also tightens the fluid solver tolerances to 1e-9 and uses an interface tolerance outerCorrTolerance of 1e-5. FSI2 runs with Δt = 0.001 s to t = 10.5 s with outerCorrTolerance 1e-6. These settings are those of the 1x level of the verification study. If a run was interrupted, Allrun refuses to start until Allclean has restored the stored files.
By default, the case uses Dirichlet-Neumann coupling accelerated with the IQN-ILS algorithm. The Robin-Neumann coupling of Tuković et al. [3], where the fluid interface pressure uses the elasticWallPressure Robin condition with an automatically selected coefficient and the interface iterations are unrelaxed fixed-point iterations, can be selected with robin. Any variant can be run in parallel by appending parallel. The Robin-Neumann variant is included for comparison rather than for routine use: on FSI3, with a thin plate wetted on both sides, every coupled time step needs of the order of 150 fixed-point iterations against about 9 IQN-ILS iterations. The plate is wetted on both faces, so its interface has two very different impedances: about 10 kg/m\(^2\) when both faces are pushed the same way (translation and bending), and about 540 kg/m\(^2\) when the plate is squeezed through its thickness. A single Robin coefficient cannot match both, and the squeeze modes contract by at best about 0.96 per iteration (see the elasticWallPressure documentation and the verification README).
Verification Study
The opt-in verification/ directory runs each variant through a mesh sweep and compares the results with the Featflow reference values [4]. For FSI2 and FSI3, it compares the mean, amplitude and frequency of the point-A displacement and of the drag and lift on the cylinder and plate, and overlays the published time history. For FSI1, it compares the steady values. The verification copies use the St. Venant-Kirchhoff law of the benchmark and integrate the force over both the cylinder and the plate.
cd verification
./Allverify                          # FSI3 IQN-ILS sweep over the 1x and 2x meshes
./Allverify --benchmark fsi1         # the same for FSI1
./Allverify --benchmark fsi2         # the same for FSI2
./Allverify --coupling robin         # the FSI3 sweep with Robin-Neumann coupling
./Allverify --study coupling         # Robin-Neumann vs IQN-ILS on FSI3
The study is separate from regressionTest.sh, which checks the FSI3 variant, and it is not run by the normal tutorial test suites. See the verification README for the mesh levels, options, acceptance criteria and recorded results.